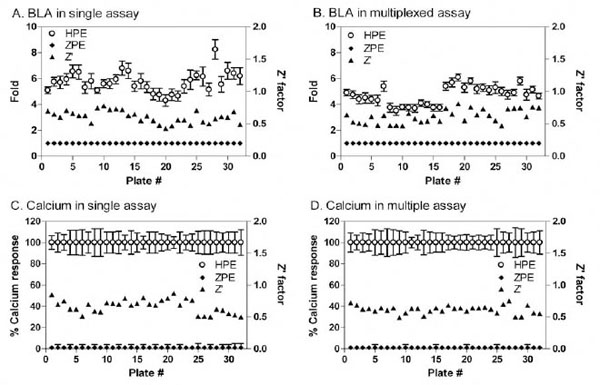
Fig. (5) HTS performance of the multiplexed assay. HPE (◊), the positive control wells in each plate were averaged and normalized to 100% effect in the four assay formats with error bars indicating the standard deviation of high control for each plate. ZPE (■), the negative control wells were normalized to 0% effect. Z’ Factor values (■) were calculated for the thirty-two compound plates tested. All Z’ Factor values were greater than 0.5, indicating the robust results from this screen. (A) Results obtained from the NFAT beta-lactamase assay in the single assay format. (B) Results determined from the NFAT beta-lactamase assay in the multiplexed assay format. (C) Results obtained from the FLIPR calcium assay in the single assay format. (D) Results determined from the FLIPR calcium assay in the multiplexed assay.

