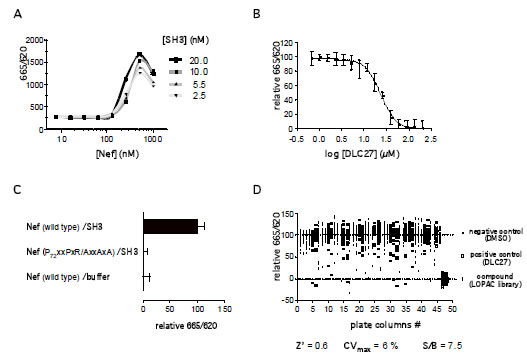
Fig. (2A) Optimization of the TR-FRET signal of the quaternary complex. Here, a concentration matrix of His-Nef vs. GST-SH3 was incubated
with 0.5 nM Eu-conjugated anti-GST antibody and 5 nM XL-conjugated anti-His6 antibody in a total volume of 5 µl for 2 h at room
temperature. (B) TR-FRET-based IC50 analysis of the PPII DLC27. At 500 nM His-Nef and 10 nM GST-SH3 an IC50 of 23.51 ± 1.31 (mean
± s.d.) µM was calculated using a four parameter logistic modelfrom GraphPad Prism 5.0. (C) TR-FRET-based PPI analysis of the Nef mutant
P72xxPxR/AxxAxA.10 nM GST-SH3 was incubated with 500 nM wild type Nef, buffer (control) or Nef P72xxPxR/AxxAxA and binding
detected using the antibody-based TR-FRET. (D) Scatterplot of a 1536-well LOPAC (Library of Pharmacologically Active Compounds)
assay plate. The controls, DMSO (open circles) and DLC27 (open squares), were used to determine the Z’-factor of 0.6 The TR-FRET signal
was normalized to the median of the controls.