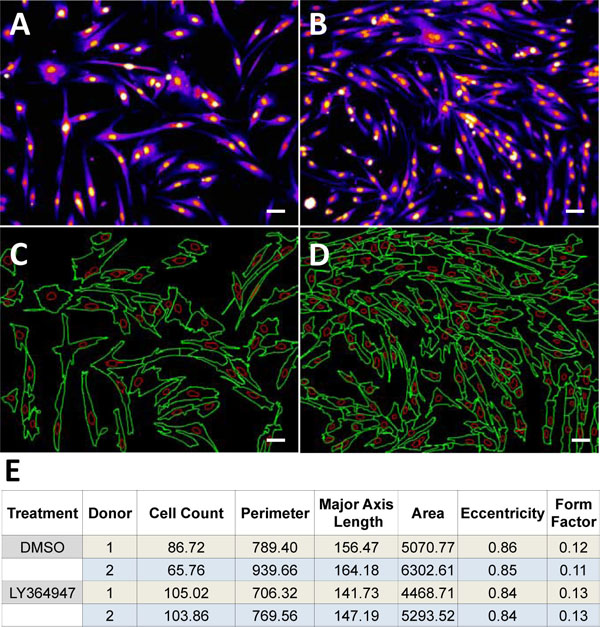
Fig. (1) Comparison of Lot 1 (A-D) satellite cells treated for 72 hrs with 0.1% DMSO (negative control: A,C) and with 25µM LY364947
(positive control: B,D). Cells were seeded at 1500 cells/well. Images portray satellite cells stained with Hoechst 33342 (A, B) and corresponding
two phase detection showing nuclei (red) and cytoplasmic outline (green) (C, D). Images are at 100X magnification, scale bar
=50µm. (E) Quantification of cellular parameters that were most distinct between negative and positive controls. Cellular dimension values
are expressed in pixels (pixel size=0.61µM).