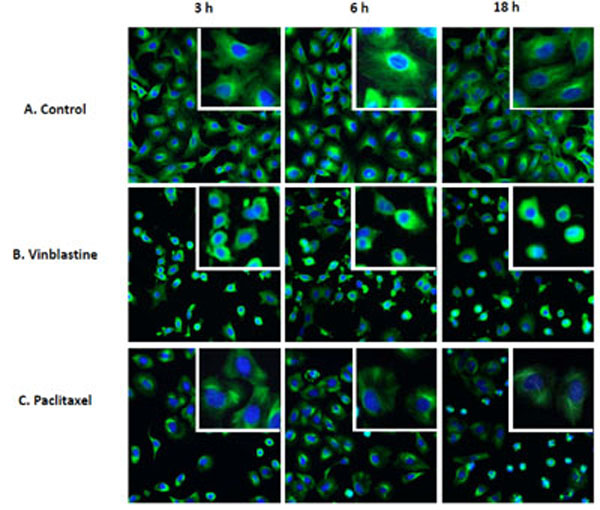
Fig. (1) High-content images of fluorescently-labeled α-tubulin in A549 cells treated with tubulin-active compounds. A549 cells were
treated with DMSO control, 2 µM vinblastine or paclitaxel for 3 h, 6 h or overnight (18 h). Microtubule structure (green) was visualized by
fluorescent labeling using anti-α-tubulin rat primary antibody followed by anti-rat-Alexa488, as described in the “Materials and Methods”.
Nuclei are counterstained using Hoescht33342 (blue). Microtubule network making up the cytoskeleton was visible in the control cells. Vinblastine
caused disruption of the microtubule network, leading to a diffused staining of α-tubulin, that was also visible after 3 h and lasted up
to 18 h. Treatment with paclitaxel induced a thickening of the microtubule fiber that was most prominent at 18 h. Enlarged images for 3 h
treatment are shown in the inserts to further visualize the changes in microtubule network upon the different treatments.