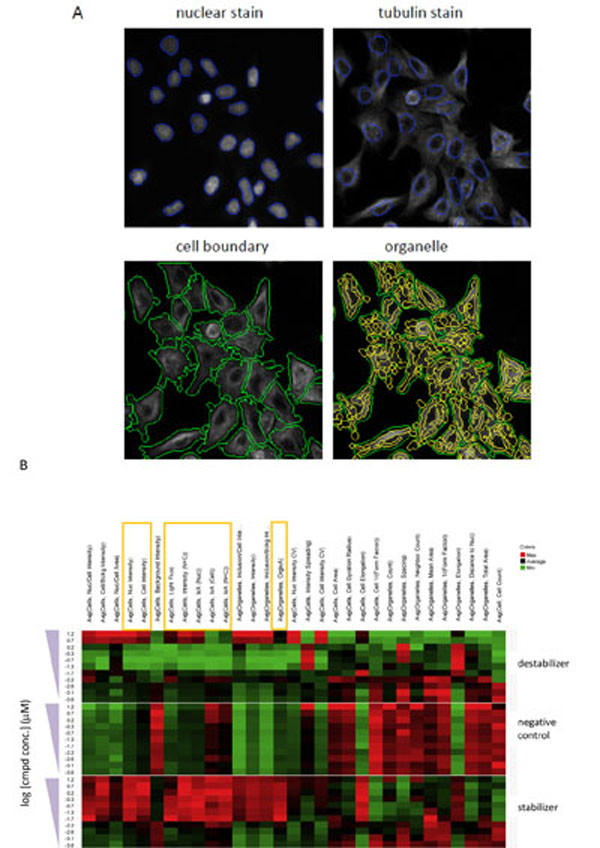
Fig. (2) Object segmentation in high-content algorithm and determination of biologically relevant high-content measurements using heat
maps.(A) Object segmentation was carried out using Multi-target analysis in GE Analysis Workstation to identify the nuclei (blue) and cell boundary
(green). Tubulin structures were further identified as intracellular “organelle” objects (yellow). (B) A549 cells treated for 6 h with decreasing
concentrations of paclitaxel, vinblastine or a known tubulin-inactive compound (negative control). The microtubule structure was
visualized by fluorescent labeling of α-tubulin and high-content imaging. The images were quantified using different measurement parameters
as shown in the figure. The measured values from the different treatments and concentrations for each parameter were organized into heat
maps to determine the parameters that can capture opposite effects of microtubule stabilizer and destabilizer. Red color in the heat maps indicates
the highest value, whereas green color indicates the lowest value, and average values are shown in black. The heat maps reveal that
several cell or organelle intensity measurements (highlighted in rectangles) may capture biologically relevant changes.