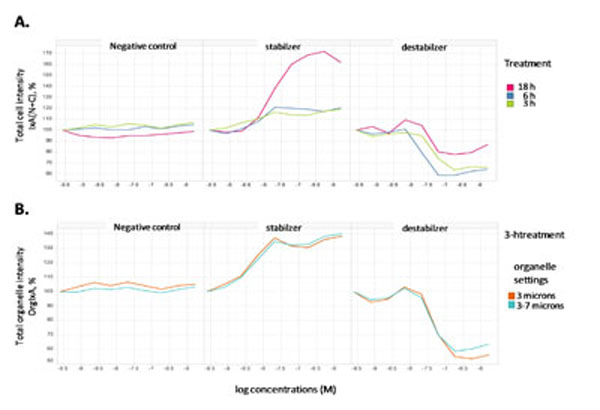
Fig. (3) Quantification of cell and organelle intensity from concentration-response data.Cells from treatment with a negative control compound, paclitaxel or vinblastine for 3, 6 and 18 h were stained for microtubule structures as
described in “Materials and Methods”. (A) Tubulin staining was quantified as total cell intensity (integrated intensity N+C), which is the average
light intensity measured from the whole cell multiplied by the average area of cell. (B) Tubulin staining from 3-h treatment was quantified
as total organelle intensity (integrated organelle intensity), which is the average light intensity measured from the identified organelle
structures multiplied by the average area of cell. Microtubule structures were identified using two different parameters (3 microns or 3-7 microns)
to compare the assay window. Either parameter is found to produce reasonable windows for both paclitaxel and vinblastine. The EC50
values for the stabilizer were determined as 4.2 nM (3 microns) and 4.6 nM (3-7 microns) and IC50 values for the destablizer as 58 nM (3
microns) and 45 nM (3-7 microns).