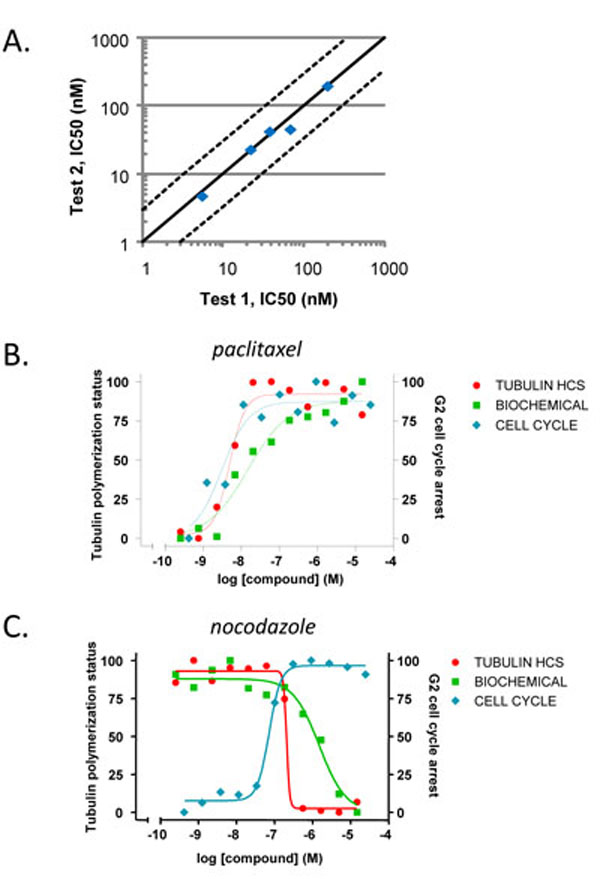
Fig. (4) Assay final validation and comparison among different assays.(A) Correlation plot to demonstrate potency reproducibility of tubulin high-content assay. A set of five compounds including both stabilizers
and destabilizers were assayed in two independent experiments. The solid diagonal line illustrates theoretical 1:1 correlation. The two dash
lines mark the limits for 3-fold difference from the theoretical line. (B–C) The activities of the following compounds were then compared in
high content analysis, cell cycle and biochemical assays: (B) tubulin stabilizer paclitaxel and (C) destabilizer nocodazole. For tubulin high-content
assay, data were analyzed by measuring total organelle intensity. For cell-cycle assay and biochemical tubulin polymerization assay,
data were analyzed as described in “Materials and Methods”. All data were normalized by taking the maximum values as 100%. For paclitaxel,
the potency values estimated in the three assays are 4 nM (high-content), 10 nM (biochemical) and 2 nM (cell-cycle). With nocodazole,
the potency values estimated in the three assays are 244 nM (high-content), 2.292 µM (biochemical) and 72 nM (cell-cycle).