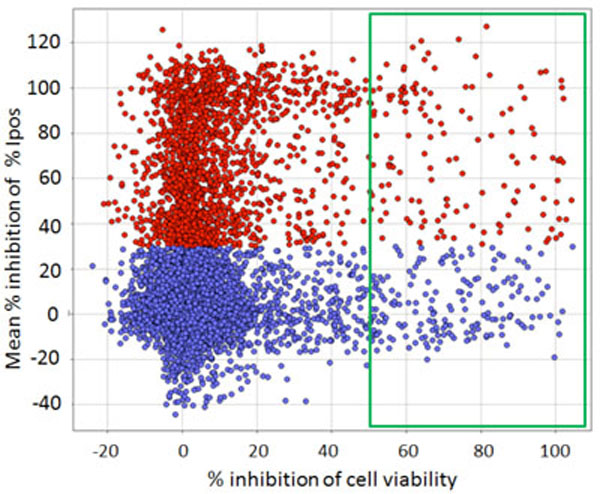
Fig. (10) Confirmation of the primary screen compounds (Y axis) vs. viability counterscreen (X axis). Compounds were run at 10 μM in
triplicate. Data are normalized as the % of controls on each test plate; each point is the Mean of 3 replicates. Unconfirmed screening hits are
marked in blue; confirmed positives are marked in red. Compounds with ≥ 50 % inhibition of cell viability in the counterscreen are in the
green box. Of the confirmed positives, 122 showed ≥ 50% inhibition of cell viability (red points in green box) and were eliminated from
further consideration.