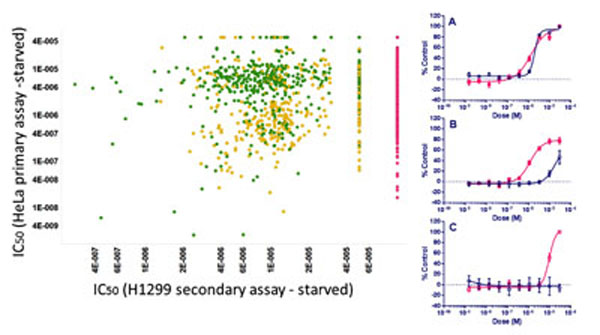
Fig. (12) Left: Dose response IC50 values (M) of ~1,200 compounds which were designated Active in the Primary and Counter screen assays
in EGFP-LC3-HeLa cells plotted vs. their cytotoxicity activity in the Secondary starvation assay in H1299 cells. So that they appear on the
plot, compounds are set to 100 μM activity if inactive (red, n = ~450), and those with IC50 values > 30 μM are set to 50 μM (n= ~50). For the
two secondary assays in H1299 cells, compounds designated Active Specific (green) were compounds which gave IC50 values in the starvation
medium which were 3x or more lower than in the parallel assay in full growth medium (~400 compounds). Active Non-specific compounds
(yellow) have similar IC50 values in both formats. Right: Examples of compound dose responses obtained in the secondary assay
(pink: starved; blue: full growth medium). (A): Active Non-specific, (B) and (C): Active Specific.