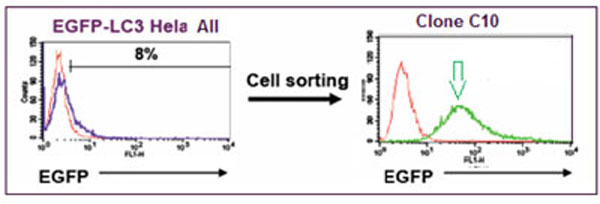
Fig. (2) Flow cytometry analysis of the EGFP-LC3 HeLa cell population before clonal selection (left panel, blue line) and after (right panel,
green line), where 8 % of the population were expressing EGFP-LC3, compared to WT HeLa cells (red line). Clone C10 (green line/green
arrow) was produced by single-cell sorting of the mixed population, expanded, and selected because of its high fluorescent signal.