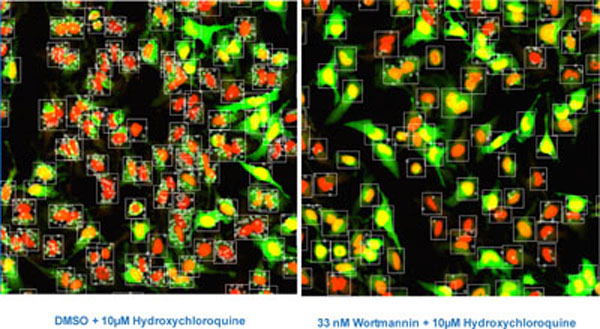
Fig. (4) Images of HeLa-EGFP-LC3 cells after 2 hr starvation; cells were stained with Draq5 to indicate nuclei (red, Channel 1), EGFP-LC3
is shown in green (Channel 2). The algorithm Granularity Analysis Module GRN1 was applied to first identify cell cytoplasm by expanding
out a set number of pixels from the nucleus boundary designated in Channel 1 (large box) and then identify EGFP-autphagosomes located
within the cell mask, which are counted as “grains” (small boxes). Other measurements are also made, e.g. brightness of objects in each
Channel; nuclear size and cytoplasm area. Typical images of the assay controls are shown; the left panel shows cells after 2 hr starvation and
the right shows cells after 2 hr starvation in the presence of the inhibitor wortmannin.