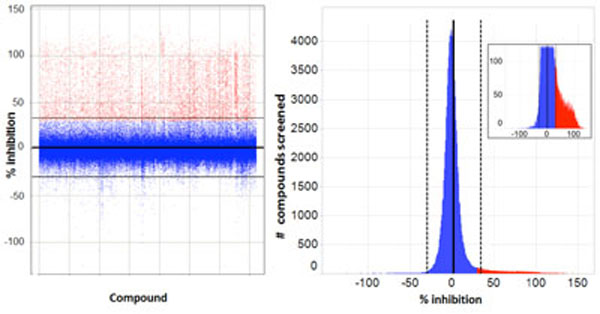
Fig. (8) Primary screen - Spotfire plots of results. Left: scatter plot (each point is a separate compound) with normalized results for primary
screening (% inhibition of autophagy vs. compound tested). Horizontal lines represent Mean with ranges ± 2 x SD (Mean = 1.8 ± 15.9). Compounds
were selected positive at ≥ 30% inhibition and are marked in red, rejected compounds in blue. Right: values binned as a histogram of
activity distribution of all compounds marked as for the Scatter plot; inset is an expanded view of the distribution of selected positives.