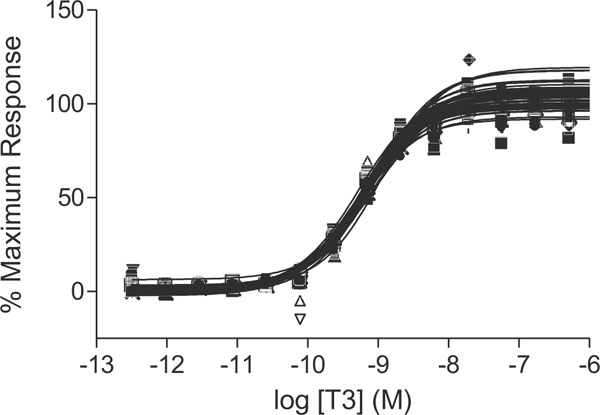
Fig. (2) The intra-plate T3 dose-response curves for 27 different plates. In each plate T3 was used as positive control. After plating at
1500 cells/well in 1536-well plates and incubated for 4 h, cells were stimulated with the indicated concentration of T3 for 24 h. Log M T3
concentrations are indicated on the x-axis.