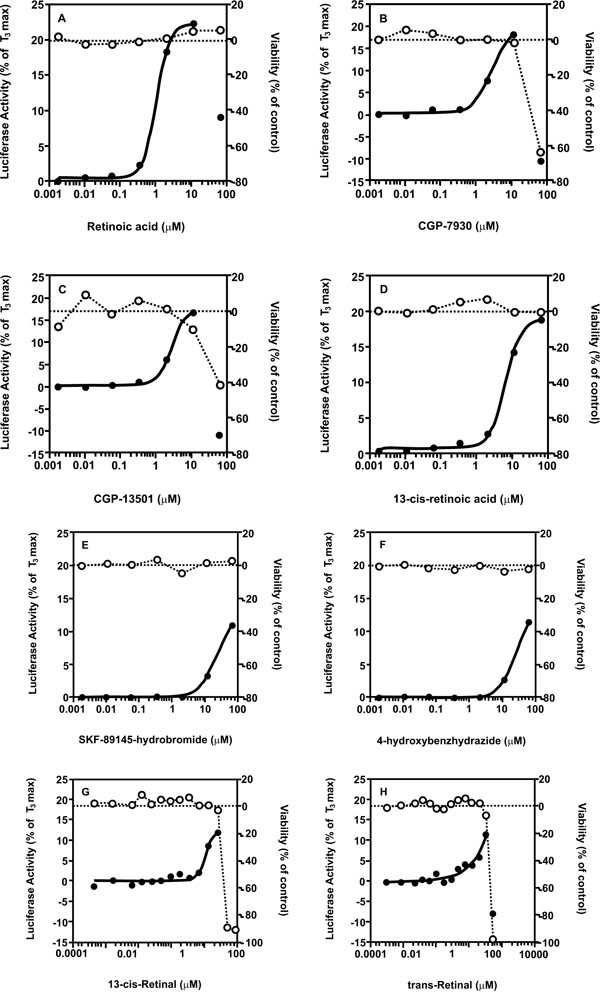
Fig. (3) Examples of agonists identified in the LOPAC and NTP libraries screening. Open circles, cell viability as a percentage (%) of
vehicle control values; closed circles, luciferase activity as a % of vehicle control values, on the right and left y-axes respectively. Ligand
concentrations in mM are indicated on the x-axis.