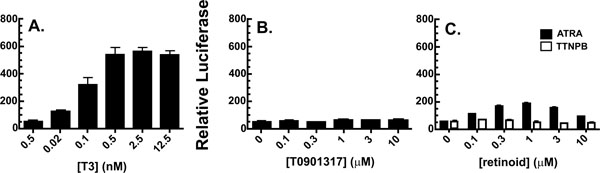
Fig. (4) GH3.TRE-LUC cells are activated by T3 and all trans retinoic acid but not RAR or LXR specific ligands. A. Dose response
curve of T3 induced reporter gene luciferase values in a 24 well format, normalized to total protein values. B. Lack of induction of the reporter
gene luciferase activity by any concentration of an LXR specific ligand (T0901317). C. Low induction of the reporter gene luciferase activity
by all trans retinoic acid (ATRA; black bars) consistent with the qHTS results, but not by the RAR specific ligand TTNPB (white bars). Concentrations
of ligands in nM (for T3) and μM (all other compounds) are indicated on the x-axis.