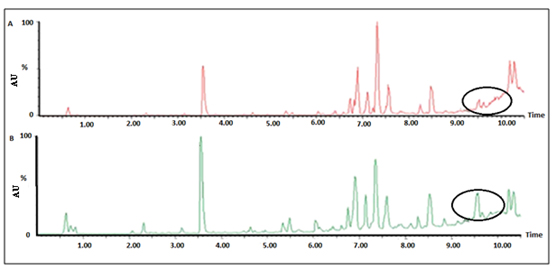
Fig. (10)
Plots from UPLC/QTOF/MS. A and B shows the typical total ion current chromatograms of plasma obtained from an EOC patient and a normal control, respectively.