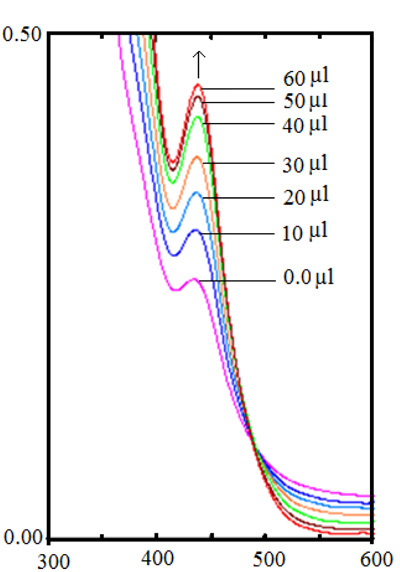
Fig. (3)
Absorption spectra of complex
1
with increasing concentration of CT-DNA.