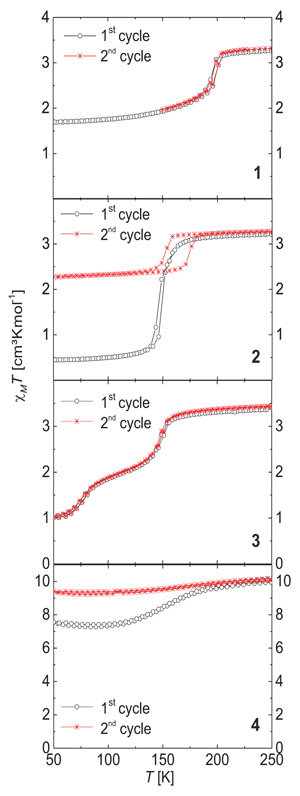
Fig. (3)
Plot of the
χ
M
T
product
vs
.
T
in the 250 – 50 K range for the complexes
1
–
4
discussed in this manuscript. Prior to the second cycle the sample was heated to 400 K.