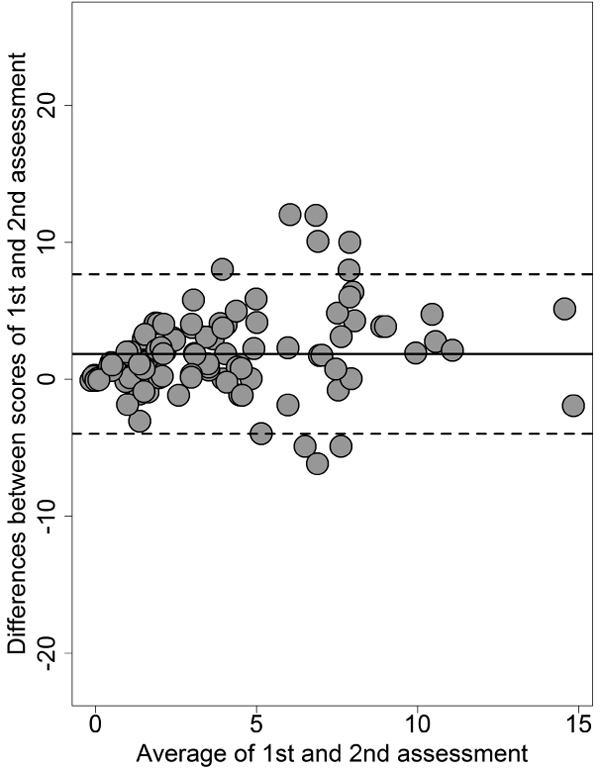
Fig. (1)
Bland-Altman plot of the PQ-B frequency score at test-retest assessment (n=114). The horizontal axis shows the mean of the two measurements ([test + retest]/2), while the vertical axis reports the absolute difference between the test and the retest (retest – test). Most values are expected to be within the 95% limit of agreement (average difference ± 1.96 standard deviation of the difference).