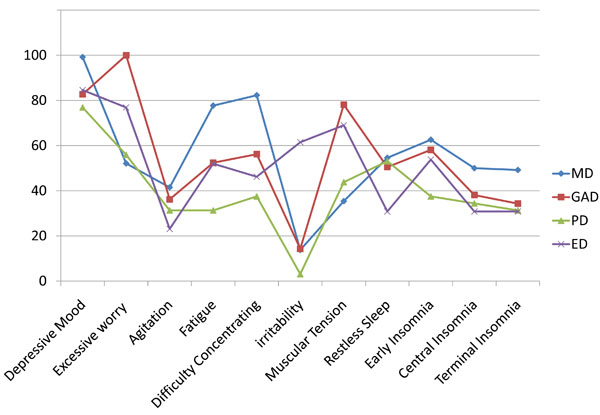
Fig. (1)
Occurrence of specific symptoms across different diagnoses.Vertical Axis reports percentage of occurrence of the symptoms according to different diagnoses.