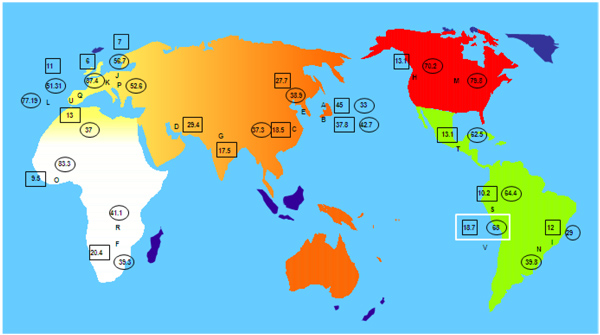
Fig. (2)
World population’s frequency pattern of HLA-G*01:04 and HLA-G*01:01 alleles. HLA-G*01:04 allele frequencies are marked by a square and HLA-G*01:01 allele frequencies are marked by a circle. Allele frequencies of each population and references are specified below.A- Japan pop 14: G*01:04→ 45%, G*01:01→ 33% [71]
B- Japan pop 15: G*01:04→ 37.8%, G*01:01→ 42.7% [64]
C- China Zhejiang Province Han: G*01:04→18.5%, G*01:01→ 37.3% [63]
D- Iran Tehran pop 2: G*01:04→ 29.4% [58]
E- South Korea pop 7: G*01:04→ 27.7%, G*01:01→38.9% [72]
F- Zimbabwe Harare Shona pop 2: G*01:04→20.4%, G*01:01→ 39.3% [73]
G- India Lucknow pop 2: G*01:04→ 17.5% [57]
H- USA African American pop 6: G*01:04→ 13.1%, G*01:01→ 70.2% [64]
I- Brazil Parana mixed: G*01:04→ 12%, G*01:01→ 29% [74]
J- Denmark pop2: G*01:04→ 7% [75], G*01:01→ 56.7% [76]
K- Germany pop5: G*01:04→ 6%, G*01:01→ 87.4% [60]
L- Portugal Azores Terceira Island: G*01:01→ 77.19% [41]
M- USA South Dakota Hutteritie: G*01:01→ 79.8% [77]
N- Brazil Sao Paulo pop 2: G*01:01→ 39.8% [45]
O- Ghana: G*01:04→ 9.5%, G*01:01→ 83.3% [64]
P- Poland pop 2: G*01:01→ 52.6% [62]
Q- Spain pop 2: G*01:04→ 11%, G*01:01→ 51.31% [23]
R- Zambia: G*01:01→ 41.1% [78]
S- Titikaka Lake Uros: G*01:04 → 10.2%, G*01:01→ 64.4% [44]
T- Guatemala Mayans: G*01:04→ 13.1%, G*01:01→ 62.5% [44]
U- Portuguese: G*01:04→13%, G*01:01→ 37% [79]
V- Amerindians from Madrid: G*01:04→ 18.7%, G*01:01→ 68% (present study)