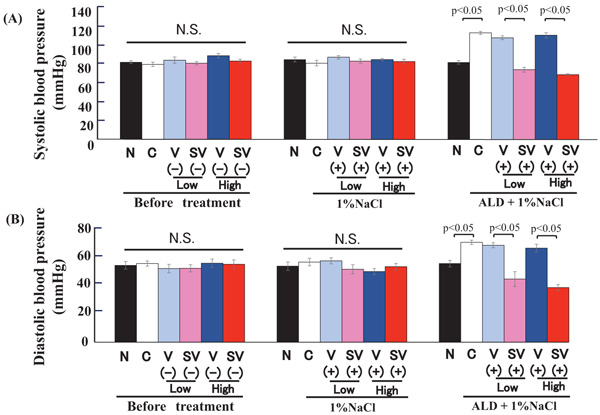
Fig. (1) % Renal tubule fibrosis.(A) The upper panel shows systolic blood pressure. Left graph; there is no significant change in systolic blood pressure before medication in AT1aR-KO mice. Middle graph; there is no significant change in systolic blood pressure after the Sac/Val (low dose (30 mg/kg/day), high dose (60 mg/kg/day)) or valsartan (low dose (15 mg/kg/day), high dose (30 mg/kg/day)) treatments. Right graph; after the treatment with aldosterone and 1 % NaCl, systolic blood pressure is significantly increased (p<0.05), and Sac/Val (low and high dose) significantly decreases the systolic blood pressure compared to valsartan (low and high dose) group (p < 0.05).(B) The lower panel shows diastolic blood pressure. Left graph; there is no significant change in diastolic blood pressure before treatment in AT1aR-KO mice. Middle graph; there is no significant change in diastolic blood pressure after Sac/Val (low dose (30 mg/kg/day), high dose (60 mg/kg/day)) or valsartan (low dose (15 mg/kg/day), high dose (30 mg/kg/day)) treatment. Right graph; after the treatment of aldosterone and 1 % NaCl, diastolic blood pressure is significantly increased (p<0.05), and Sac/Val (low and high dose) significantly decreases the diastolic blood pressure compared to valsartan (low and high dose) group (p < 0.05). N, Non-treatment; Con, Control; V, Valsartan; SV, Sacubitril/Valsartan; Low, low dose; High, high dose; NaCl, 1 % NaCl; ALD, aldosterone.