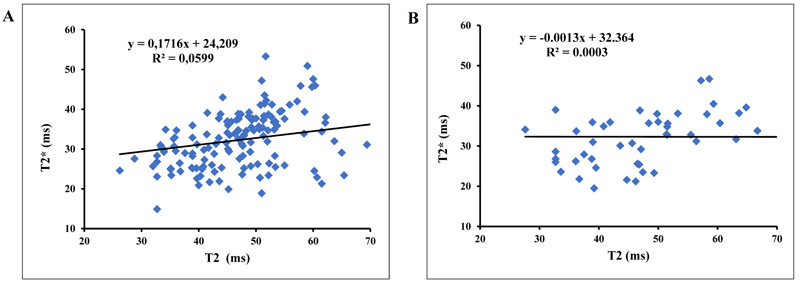
Fig. (2)
The plot of T2* and T2 at 1.5T. (
A
) Plot for asymptomatic volunteers and (
B
) Plot for symptomatic patients.