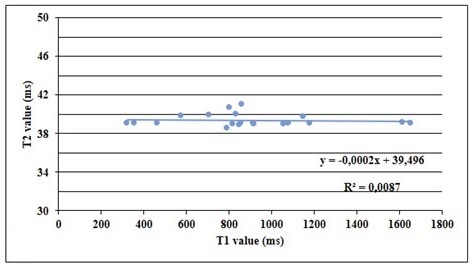
Fig (3)
Plot curves of T1 and T2 for patient group.