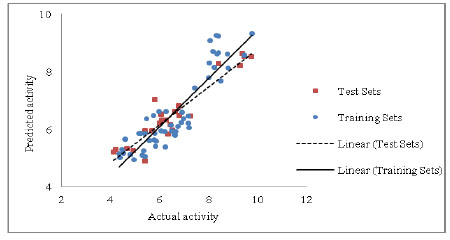
Fig. (1)
Chart of actual activity
vs
. predicted activity for the training set and test set.