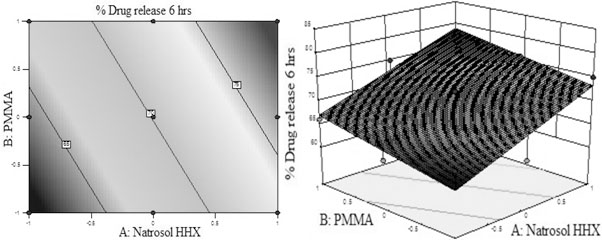
Fig. (7)
(
A
) Contour plot and (
B
) response surface plot showed relationship in between % drug release at 6 hrs and levels of polymers (Hydroxyl ethyl cellulose HHX and PMMA).