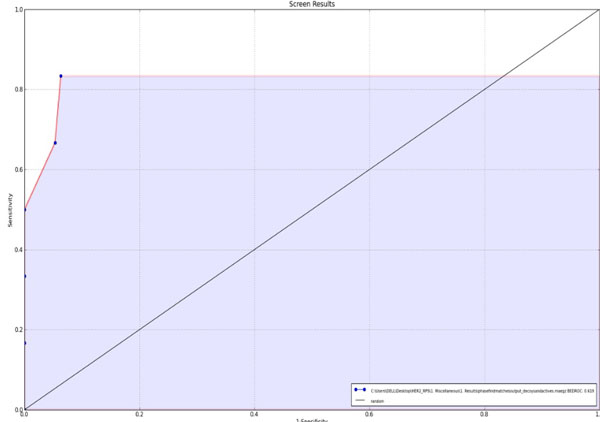
Figure 3a
ROC Plot between 1-specificity and sensitivity.