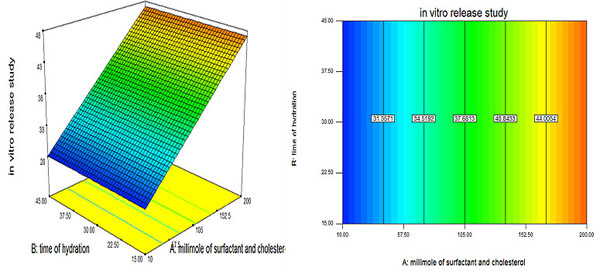
Fig. (6)
Response surface (3D) and contour plots showing the effects of the significant factors on the responses. [s:c - Surfactant: cholesterol ratio].