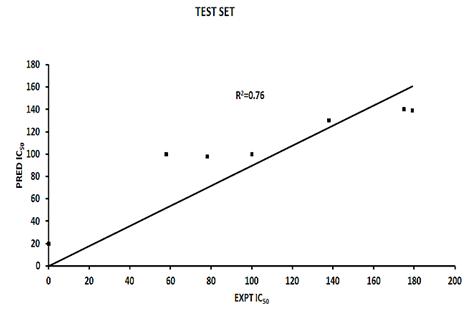
Fig. (2)
Predicted
versus
actual activity values for the test set of the phase model with the highest R
2
value.