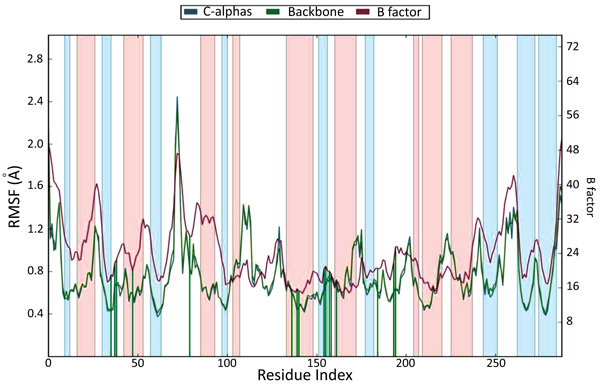
Fig. (5)
Protein RMSF plot (On this plot, peaks indicate areas of the protein that fluctuate the most during the simulation and Protein residues that interact with the ligand are marked with green-colored vertical bars.)