Fig (2)
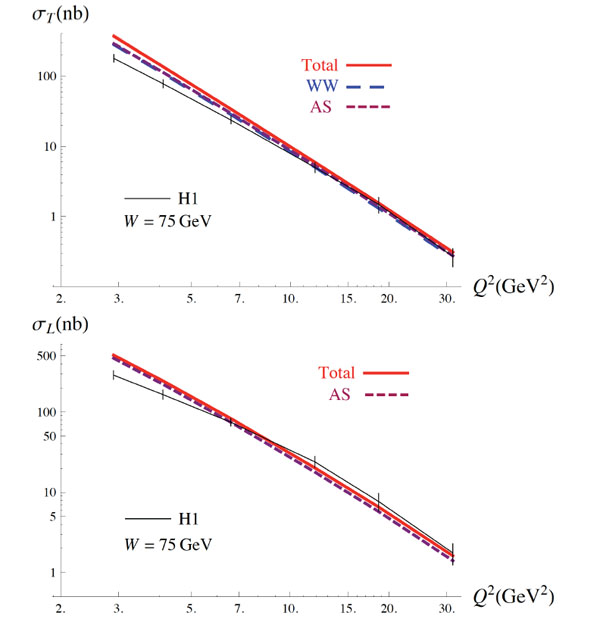
Left: Total, WW and AS contributions to σ
T
vs
Q
2
, compared to H1 [9] data. Right: Total and AS twist 2 contributions to σ
L
vs
Q
2
compared to H1 data.