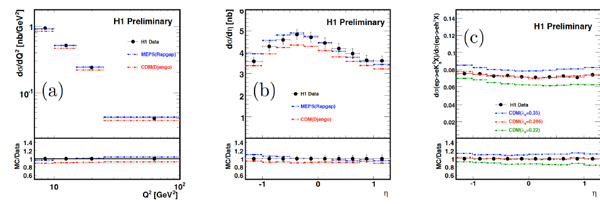
Fig (2) Differential Ks0 production cross sections as a function of (a) the photon virtuality squared Q2 , (b) its pseudorapidity η and (c)
ratio of Ks0 to charged particle production as a function of η in comparison to RAPGAP (MEPS) and DJANGOH (CDM). The inner (outer)
error bars show the statistical (total) errors. The ratios “MC/Data” are shown for the different Monte Carlo predictions. For comparison, the
data points are put to one.