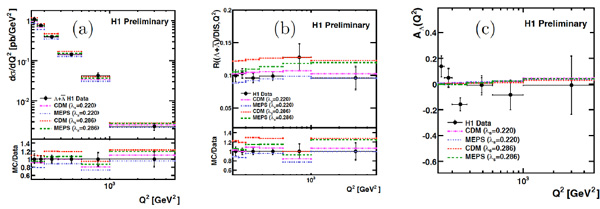
Fig (3) The Q2 dependence of (a) differential Λ production cross section, (b) ratio R(DIS) of Λ production to DIS cross section and (c)
asymmetry AΛ in comparison to RAPGAP (MEPS) and DJANGOH (CDM) with two different values of λΛ. The inner (outer) error bars
show the statistical (total) errors. The “MC/Data” ratios are shown for different Monte Carlo predictions. For the ratios the data points are put at one for comparison.