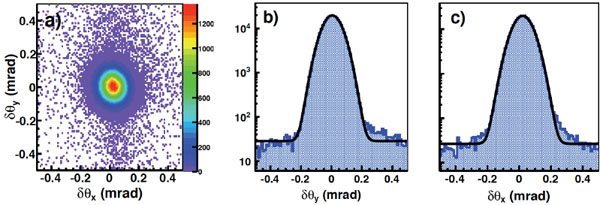
Fig.(2) (color online) Distribution of δθ y vs δθ x for both detector pairs in horizontal RPs (a) and their projections in δθ y (b) and δθ x (c). The overlaid curves represent the fits with a Gaussian signal and a linear background. The σ values of distributions are ≈ 58 μ rad, consistent with beam angular divergence, and the background-to-signal ratio under the Gaussian distributions in ±3 σ is ≈ 0.4%.