Fig.(3)
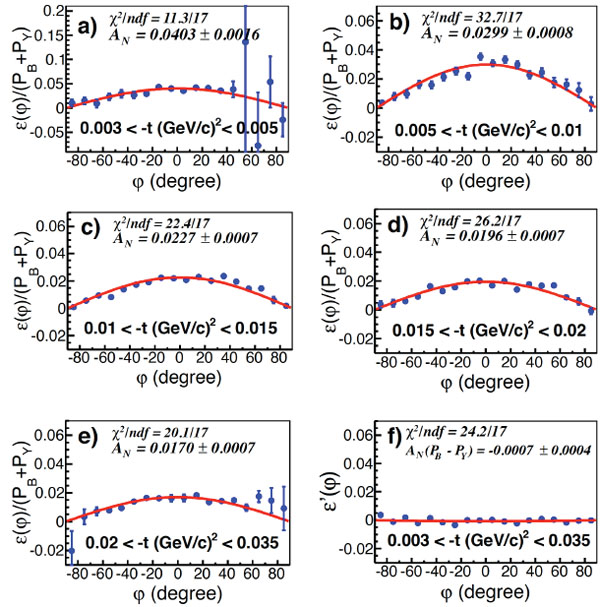
(color online) The asymmetry ε (φ ) / (P
B
+P
Y
) for the five t -intervals (a) - (e). The asymmetry ε ′(φ ) for the whole measured t - range (f). The red curves represent the best fit to Eq. (6) (a) - (e) and Eq. (7) (f).