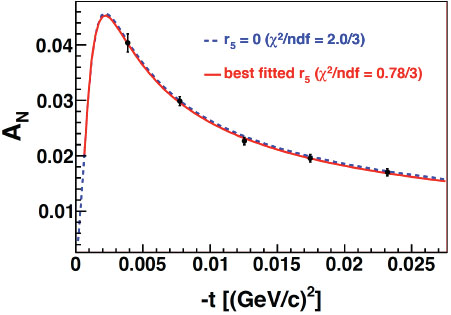
Fig.(4) (color online) The measured single spin asymmetry AN for five −t intervals. Vertical error bars show statistical uncertainties. Statistical error bars in −t are smaller than the plot symbols. The dashed curve corresponds to theoretical calculations without hadronic spin-flip and the solid one represents the r5 fit.