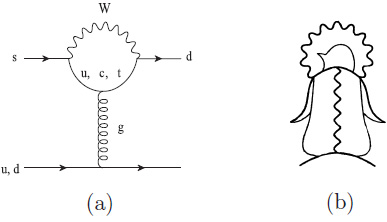
Fig. (3)
(
a
) Diagrams of penguin amplitudes; the picture of the (
b
) diagram was reproduced from
Parity
by permission of T. Muta & T. Morozumi.