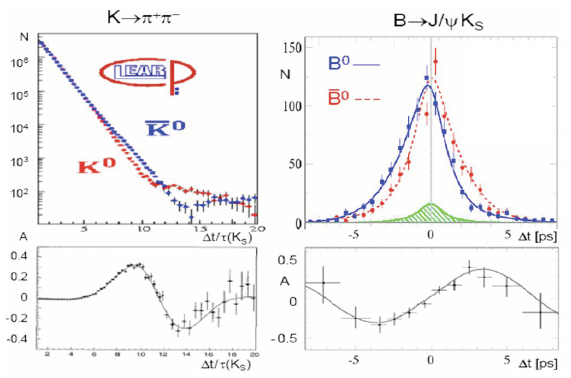
Fig. (6) The blue & red data and the lines to describe them in QFT show in the right plot obvious difference of Bd decays; furthermore they (within experimental uncertainties) are also Δt odd. The landscape on the left side is complex: the difference is much smaller on K 0vs. on average than on the right side [courtesy of K. Schubert]. B → J/ ψ KS.