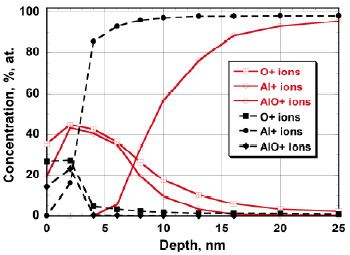
Fig. (15) Auger analysis data for Al mirror samples similar to those shown in Figs. (12-14). The solid lines (with open symbols) show the concentrations of the indicated components of the uppermost surface layer material as function of depth after exposure to deuterium plasma ions with energy 1350 eV, and the dashed lines (with closed symbols) show the same, but after a long time exposure to 60 eV ions. Initial data, after cleaning with Ar ions, are not shown for simplicity [46].