Fig. (1)
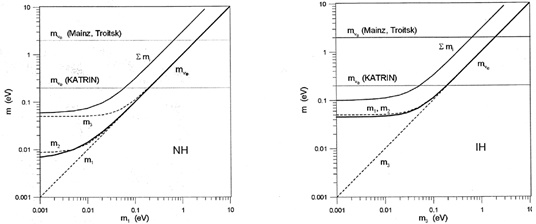
Neutrino masses mi as a function of the lightest mass m1 for the normal hierarchy NH (left panel) and m3 for the inverted hierarchy IH (right panel). We have calculated the curves for the mean values Δm212 = 7.53 ·10-5 eV2, |Δm312| ≈ |Δm322| = 2.44 ·10-3 eV2 for NH and 2.52 ·10-3 eV2 for IH, and for the admixtures | Ue1|2 = 0.6803, | Ue2|2= 0.2354 and | Ue3|2 = 0.0843 derived from [8]. Also shown is the effective neutrino mass mve, the β-spectroscopic quantity defined by Eq. (5), as well as the sum of neutrino masses  derived from cosmological measurements. Also depicted is the upper limit of resulting from the latest measurements at Mainz [38] and Troitsk [39] and the expected limit from the upcoming KATRIN experiment [40].