Fig. (13)
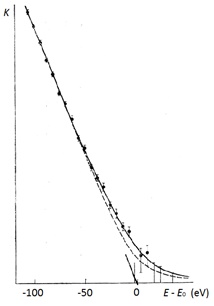
Kurie plot of the endpoint region of the tritium β-spectrum measured with a toroidal magnetic spectrometer by Tretyakov
et al
[113]. Solid and dashed lines correspond to
m
v
e
= 0 and 40 eV, respectively.