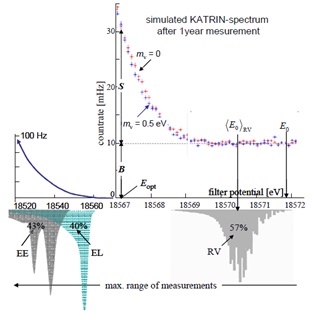
Fig. (17)
Upper right: Simulated KATRIN data in the last 5 eV below the endpoint E 0 after 1 year of measurement for neutrino mass 0 eV (upper read crosses) and 0.5 eV (lower blue crosses). Upper left: Schematic increase of the count rate towards the lower energy of β-particles. Lower half: EE and RV: Electronic and rotational/vibrational excitation of the daughter molecule (T3He)+ occurring with 43% and 57% probability, resp.; EL: energy loss of 18.5 keV beta’s within T2-gas, affecting about 40% of them. The figure is reproduced from [140].