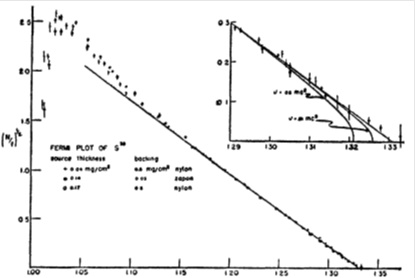
Fig. (9)
The Kurie plot of the β-spectrum of 35S measured by Cook et al. [92]. The plots shown correspond to the 35S sources of estimated thickness of 0.04, 0.14 and 0.17 mg cm-2 that were prepared on 0.5 mg cm-2 Nylon and 0.03 mg cm-2 Zapon backings. For electron energies above 90 keV, the Kurie plots are all straight lines as expected for the 35S(3/2+) → 35Cl(3/2+) β-transition. According to the authors the deviations for energies below 60 keV are influenced by source thickness and backing. The enlarged section of the Kurie plot close to the β-spectrum endpoint shows the theoretical Fermi curves for an allowed β-transition calculated for assumed neutrino masses of 0, 5 and 10 keV.