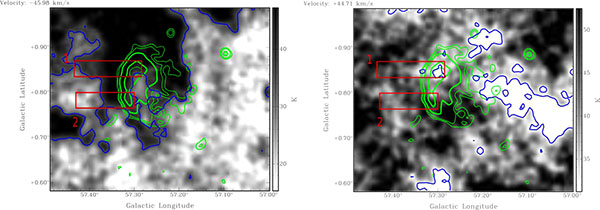
Fig. (12)
G57.2+0.8 H I channel maps -45.98 and +44.71 km s-1. The left panel shows the H I intensity decreasing coincident with the bright continuum region of the SNR, indicating real absorption. The top panel does not show such evidence for real absorption. The H I contour levels (blue) are at 32 K. The continuum contour levels (green) are at 8, 8.5, 10, 15 and 18 K.