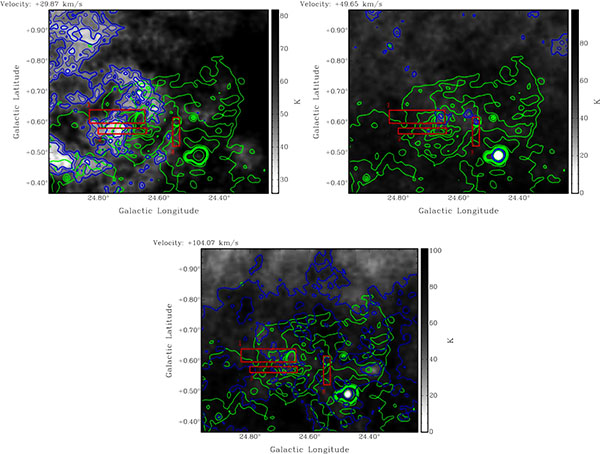
Fig. (3)
G24.7+0.6 H I channel maps +29.87, +49.65 and +104.07 km s-1. The top right panel shows the H I intensity decreasing coincident with the bright continuum region of the SNR, indicating real absorption. The other two panels do not show such evidence for real absorption. The H I contour levels (blue) are at 40, 45 and 50 K for the channel maps +29.87 and +49.65 km s-1 and 60 and 80 K for the channel map +104.07 km s-1. The continuum contour levels (green) are at 20, 25, 30, 35, 38, 40 and 100 K.