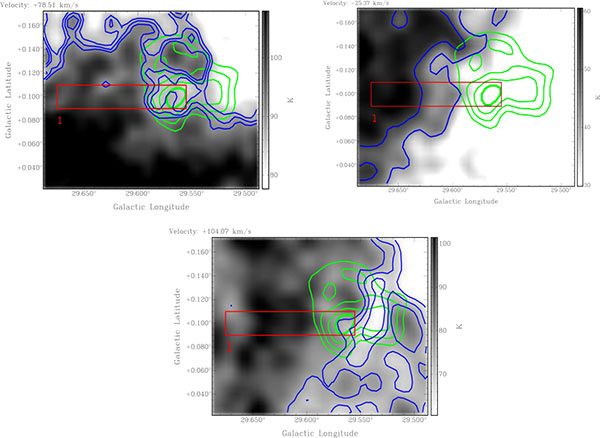
Fig. (6)
G29.6+0.1 H I channel maps -25.37, +78.51 and +104.07 km s-1. The top left panel shows the H I intensity decreasing coincident with the bright continuum region of the SNR, indicating real absorption. The other two panels do not show such evidence for real absorption. The H I contour levels (blue) are at 54 and 58 K for the channel map -25.37 km s-1, 86, 88 and 90 K for the channel map +78.51 km s-1 and 65, 70 and 75 K for the channel map +104.07 km s-1. The continuum contour levels (green) are at 24, 26, 28 and 30 K.