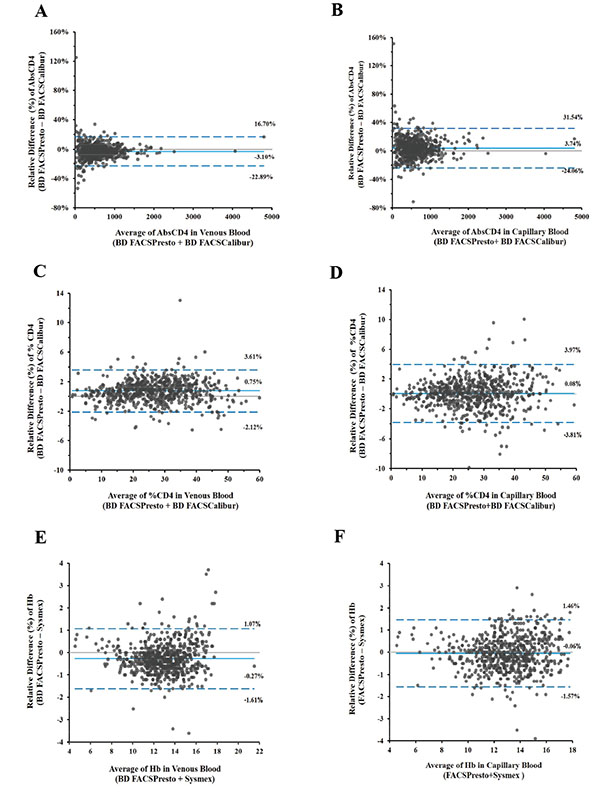
Fig. (2)
CD4 absolute counts, %CD4, and Hb bias in venous and capillary blood.
Bland-Altman plots illustrate the biases for venous (2A, 2C, and 2E) and capillary (2B, 2D, and 2F) samples with limits of agreement. Biases for CD4 cell counts are shown in 2A and 1B, for %CD4 cells in 2C and 2D, and hemoglobin in 2E and 2F. The x-axis displays the average (CD4 counts, %CD4 cells, or Hb) and the y-axis is the difference (CD4 counts, %CD4 cells, or Hb).