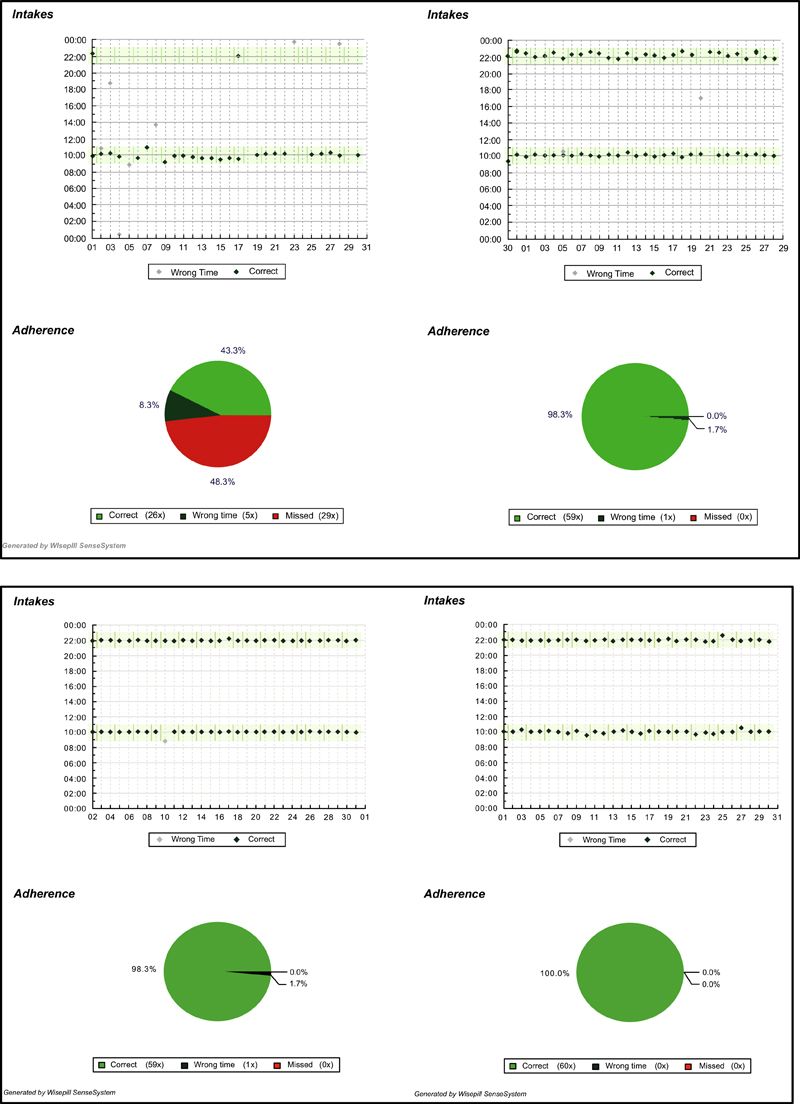
Fig. (1)
Examples of Wireless Pill Container adherence reports. Graphs show the adherence history in the pre-intervention period (Month 3, in graphs to the left) and in the second intervention month (Month 5, in graphs to the right) for two subjects. 2a (top): Reports for a patient with suboptimal adherence; 2b (bottom): Reports for a patient with optimal adherence.

