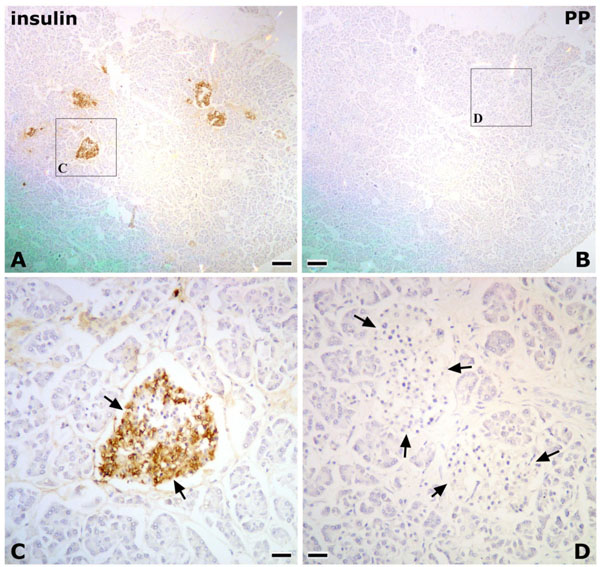
Fig. (3) Immunohistochemical analysis of the distribution of insulin- (A), and pancreatic polypeptide- (PP) (B) immunoreactive cells in the anterior region of AIPD. C and D: higher magnification of the area indicated in A and B, respectively. Arrows: insulin-(C) or PP-(D) immunoreactive cells. Scale bar: A and B = 500 µm; C and D = 100 µm.