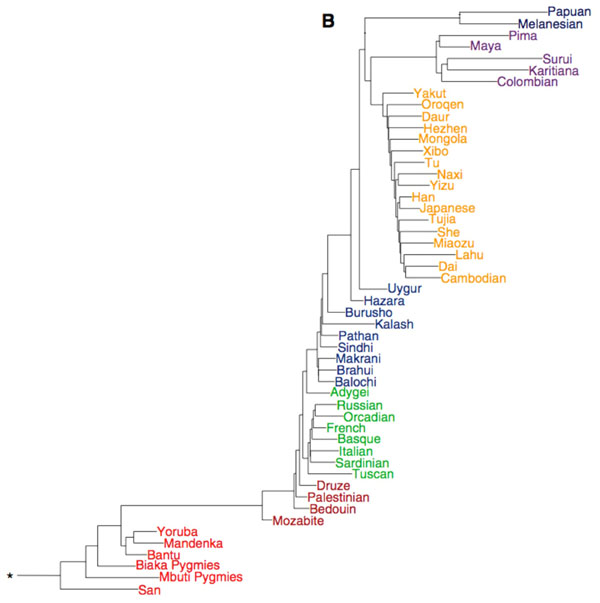
Fig. (8) Maximum likelohood tree of 51 populations of modern humans. Branches are colored according to continents/regions (red = Africa;brown = Middle Eat; green = Europe; light blue = S. C. Asia; orange = E. Asia; violet: America; dark blue = Oceania);* indicates the root of the tree (modified from Li et al. 2008 [89]).